





True Strike Rate and True Economy
- Caleb
- 24 Jul 2026
Here's the problem with normal Strike Rate and Economy: they treat every ball the same. But it's not the same. Runs come way easier in the powerplay and at the death than they do in the middle overs. So a batter who happens to face a lot of balls in those juicy phases is going to look better on paper than someone grinding through the middle, even if they're not actually the better player.
True Strike Rate and True Economy try to fix that. Instead of just counting runs, it looks at what you'd expect on that specific ball, at that specific point in the innings, and measures the player against that instead. The noise from just being in a good (or bad) spot in the game gets stripped out.
Take a look at the chart below. Average runs per over jumps around a lot across an innings — that's basically the whole reason these "true" stats exist in the first place.
Expected Runs Per Over — IPL vs CPL
Average runs per over at each stage of the innings, computed separately for each league across every game in our database.
Want the ball-by-ball breakdown too? See the full True Stats explainer.
Okay, so what does this actually look like with real players?
MS Dhoni: the finisher reputation, put to the test
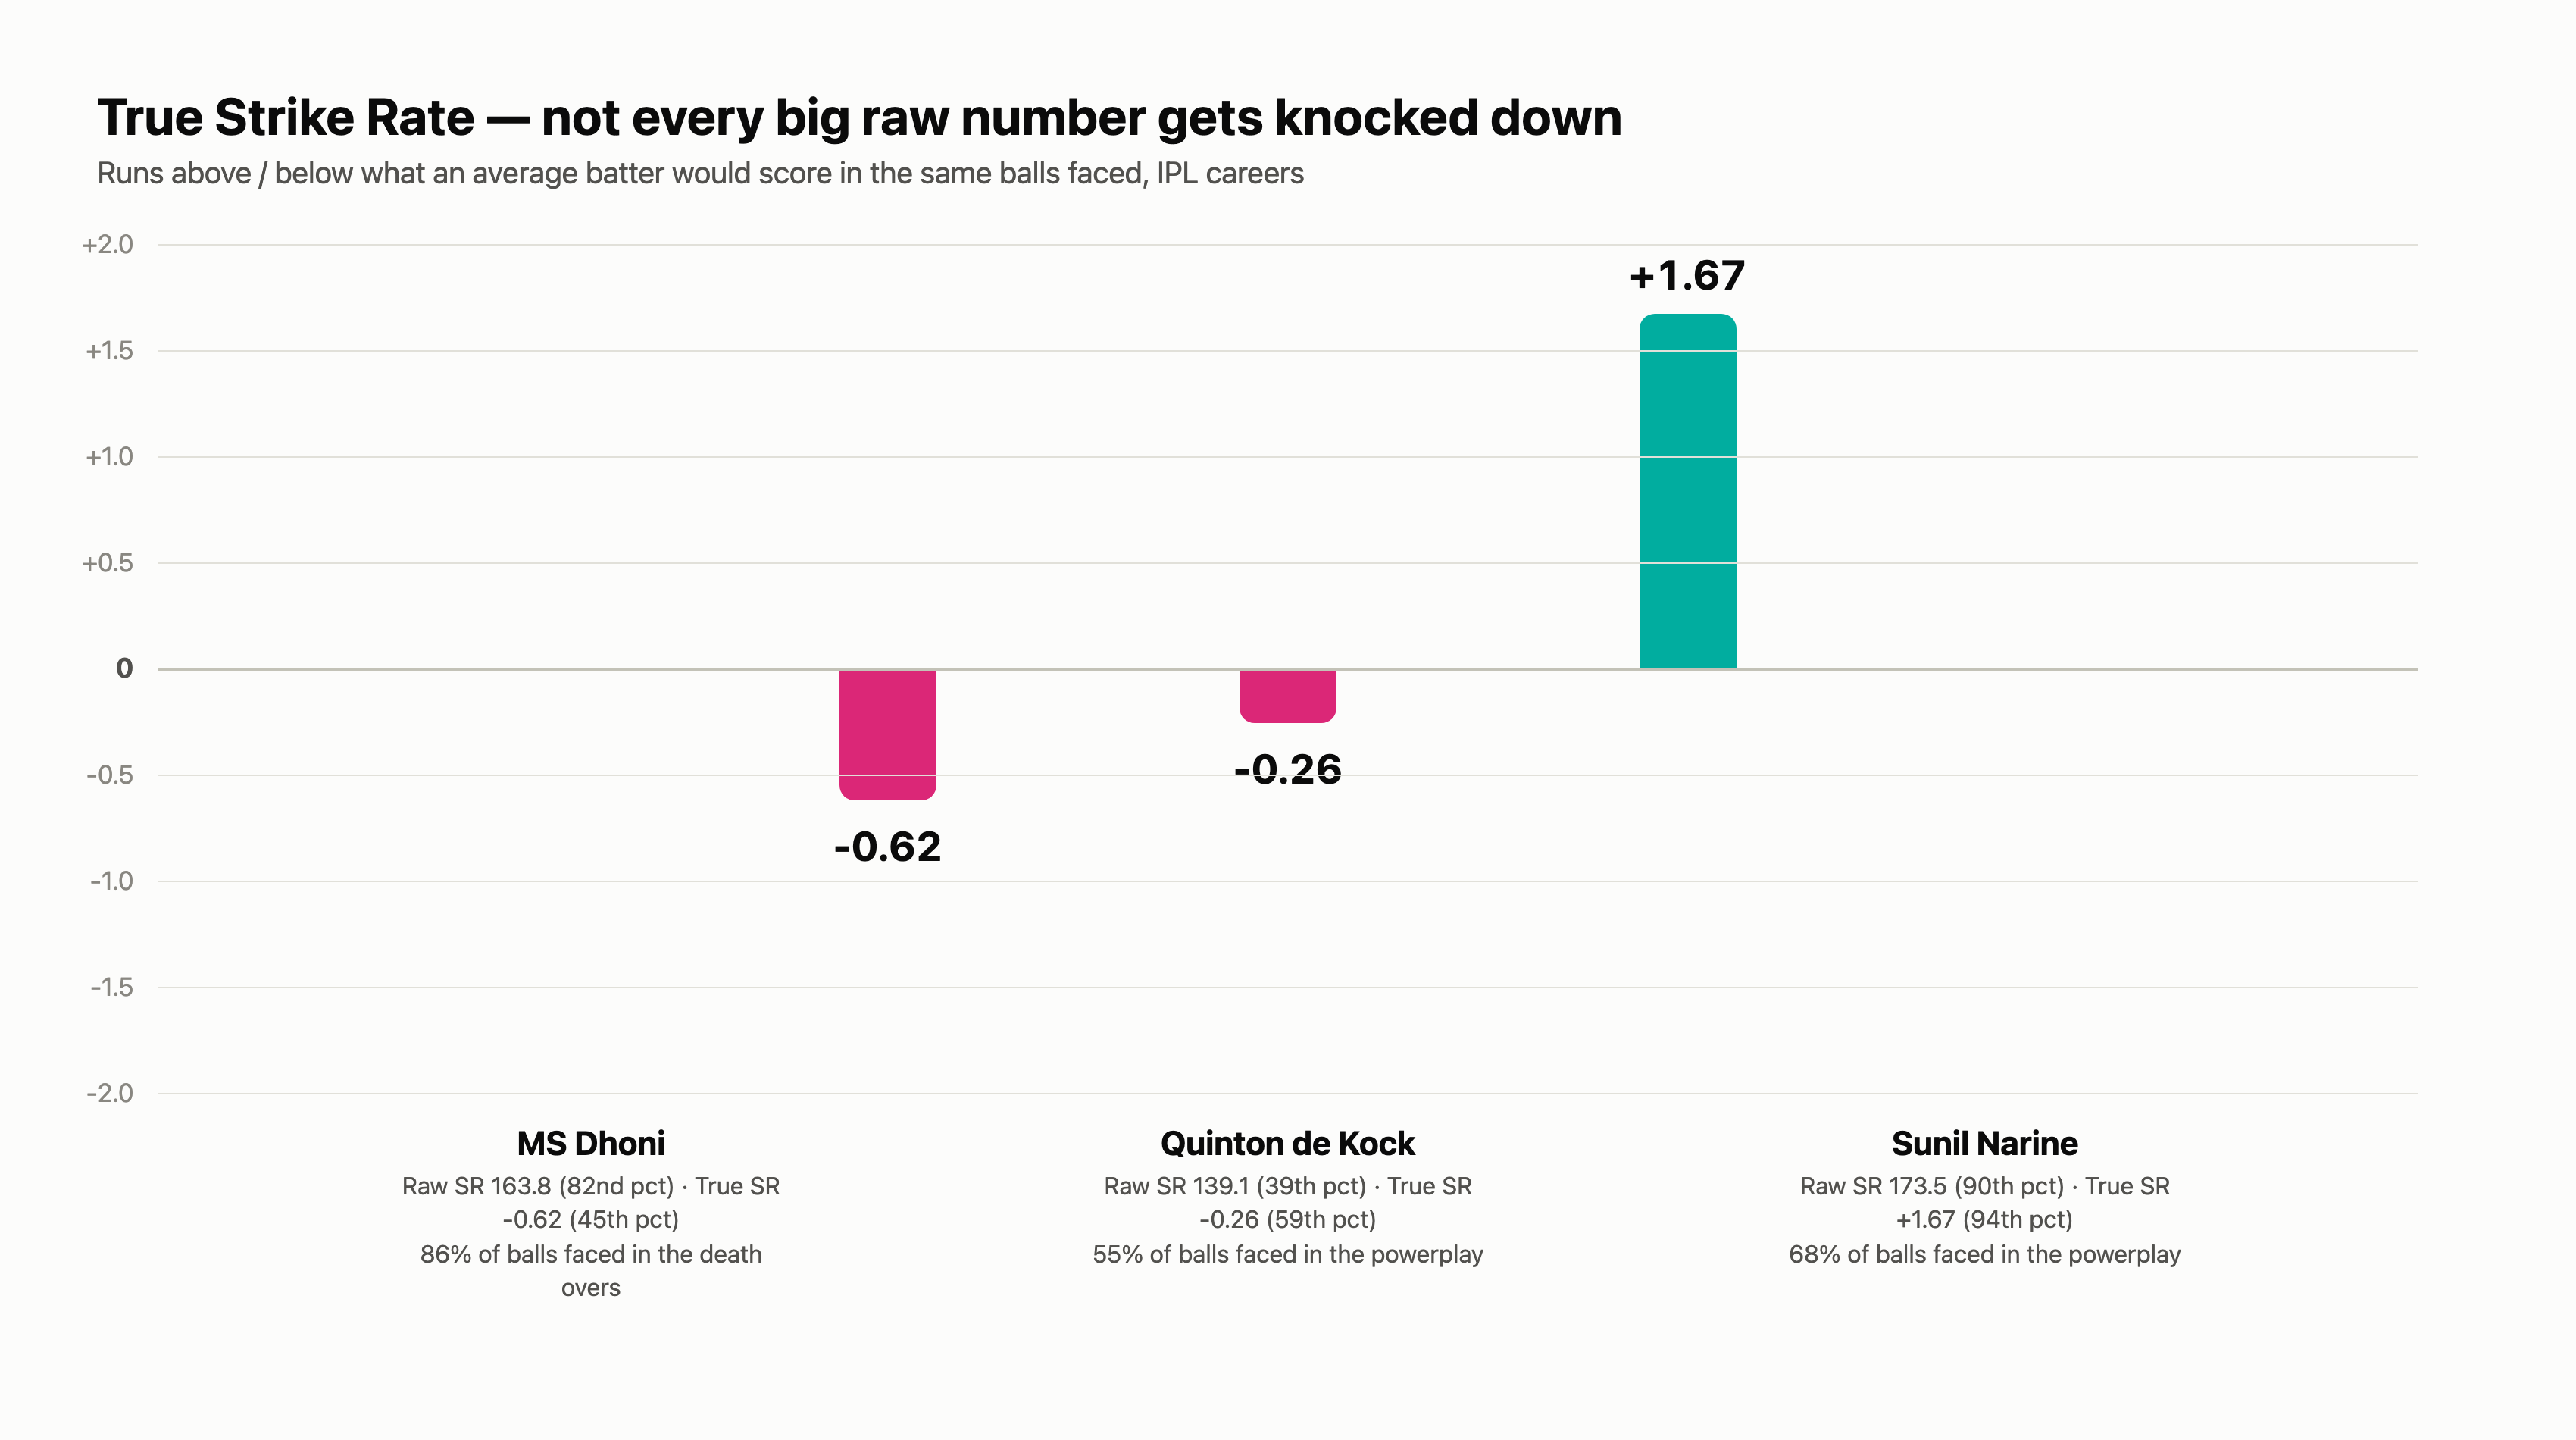
Raw Strike Rate: 163.8 (82nd percentile) → True Strike Rate: -0.62 (45th percentile)
Almost all of Dhoni's batting is in death-overs — 189 of his 218 balls came in the last four overs, where he's striking at 178.3. On the surface that's a top-20% strike rate, exactly what you'd expect from one of cricket's most famous finishers. The problem is, the death overs are also the easiest phase in the game to post a big number — everyone's swinging, the field's spread out, and the league-wide expectation for those overs is high. Measure Dhoni ball-by-ball against what an average batter does in those same situations, though, and his number falls back to basically average. 45th percentile. Raw stat says elite finisher. Adjusted stat says he's keeping pace with a very generous phase, not beating it.
Quinton de Kock: punished for playing the hard overs
Raw Strike Rate: 139.1 (39th percentile) → True Strike Rate: -0.26 (59th percentile)
Flip it around and you get the opposite story. De Kock opens the batting — 213 of his 384 balls coming in the powerplay. His raw strike rate of 139.1 looks pretty unremarkable next to the league's flashiest hitters, bottom 40%. But powerplay is a harder phase to score in than the death overs, and once you weigh that, his output flips from a below average batter to an above average batter. 59th percentile. The raw number was punishing him for choosing the hard overs. The adjusted one gives that credit back.
Sunil Narine: proof this isn't just a "gotcha" stat
Raw Strike Rate: 173.5 (90th percentile) → True Strike Rate: +1.67 (94th percentile)
Not every big number gets knocked down, and Narine's a good reminder of that. He also opens — 303 of his 446 balls are in the powerplay, same window as de Kock — but he's still striking at 168.0 there. Run that through the same adjustment and his percentile actually climbs, 90th up to 94th. This is really the pairing that matters here: True SR isn't built to deflate every big raw number, it's built to tell you which ones are real. Dhoni's collapses under the correction. Narine's holds up, and honestly gets undersold by the raw stat if anything.
Quick credit where it's due, because I didn't come up with any of this. Jarrod Kimber did, and he actually borrowed the core idea from basketball's "true shooting percentage" stat. Further reading if you want the source: "The new vocabulary of T20" and "The new way to explain cricket".